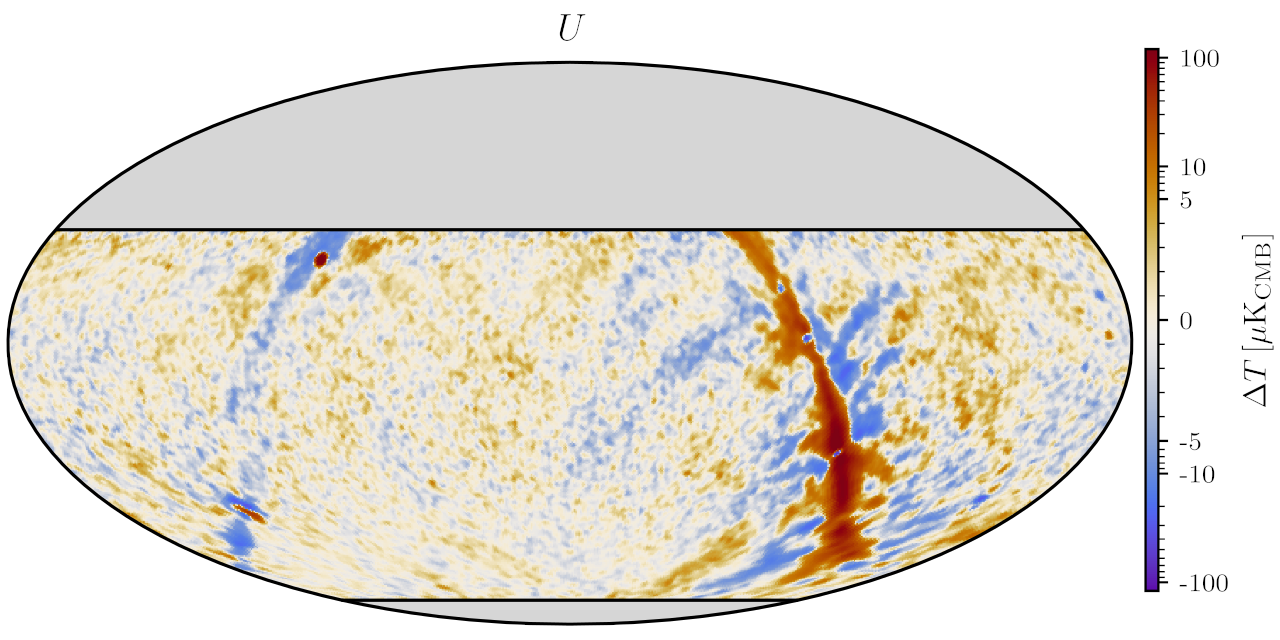
Although a variety of colormaps have previously been specifically developed for displaying cosmic microwave background (CMB) maps, none of these have been designed with perceptual uniformity or color-vision-deficiency (CVD) accessibility in mind. To improve upon this status quo, in support of publications1 for the 2022 data release for the Cosmology Large Angular Scale Surveyor (CLASS), I used Matplotlib’s Viscm tool to develop a new diverging colormap that resembles the Planck colormap but is mostly perceptually uniform and is perceived similarly by both individuals with typical color vision and those with red or green color-vision deficiencies. The Q-band Stokes U map from the CLASS paper, which uses the new colormap, is shown below.
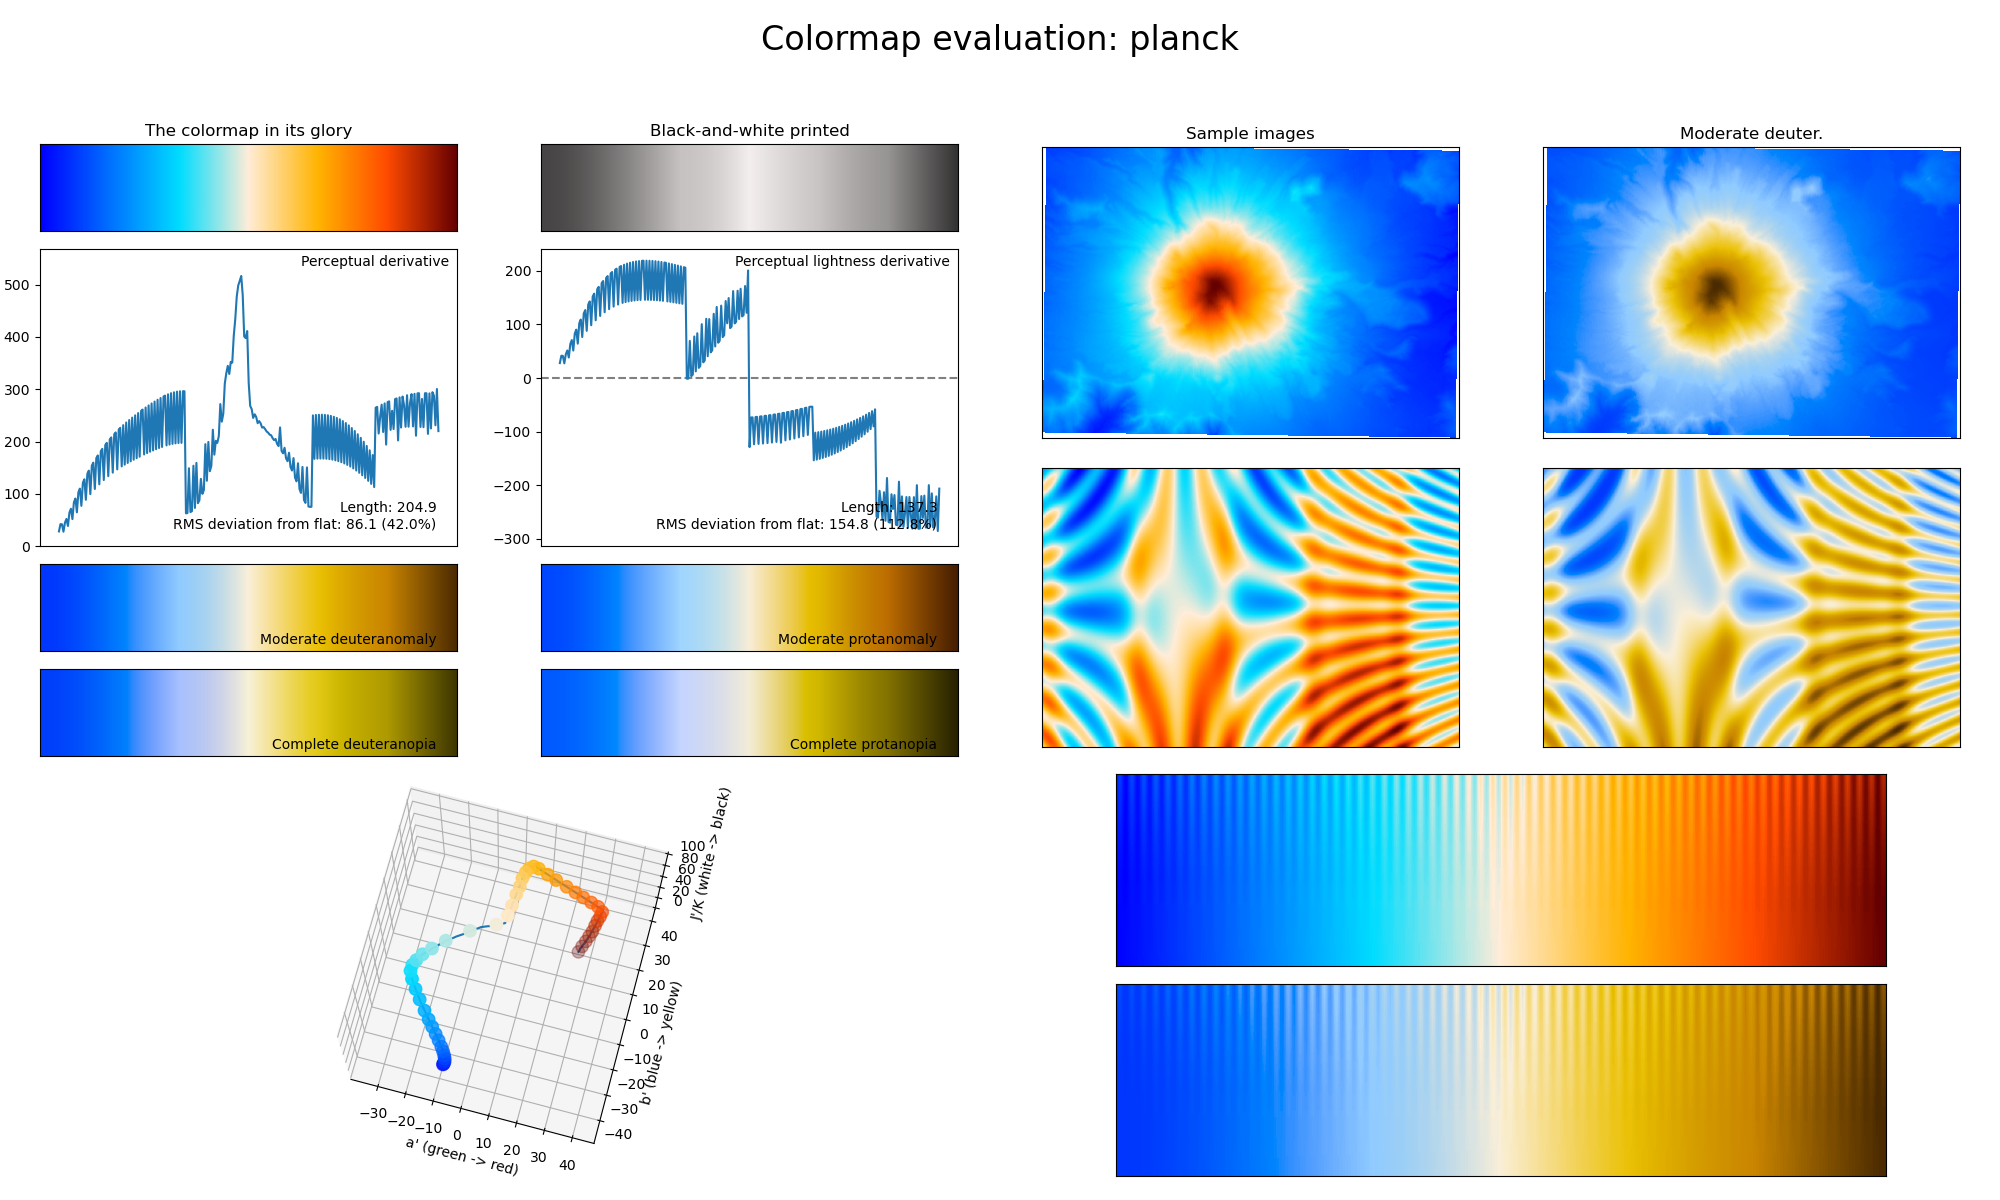
Starting with prior art, the Planck colormap is a diverging colormap, but it has discontinuities in its perceptual derivative, causing visible banding issues. Here is the output for it from Viscm.
And here is how it performs by the CVD metric I previously developed to evaluate the Turbo colormap (which performs poorly by it). Along with the cusps from the issues with the perceptual derivative, there is a clear imbalance in the metric around the center of the colormap for red and green color-vision deficiencies.

As a first attempt to improve upon this, I fit splines to the color values and applied various levels of smoothing. With small amounts of smoothing, this rounded off the perceptual discontinuities—fixing the worst of the issues—but left much room for improvement; applying more aggressive smoothing further improved the perceptual issues but also more significantly changed the colormap in a manner that my colleagues did not like aesthetically.
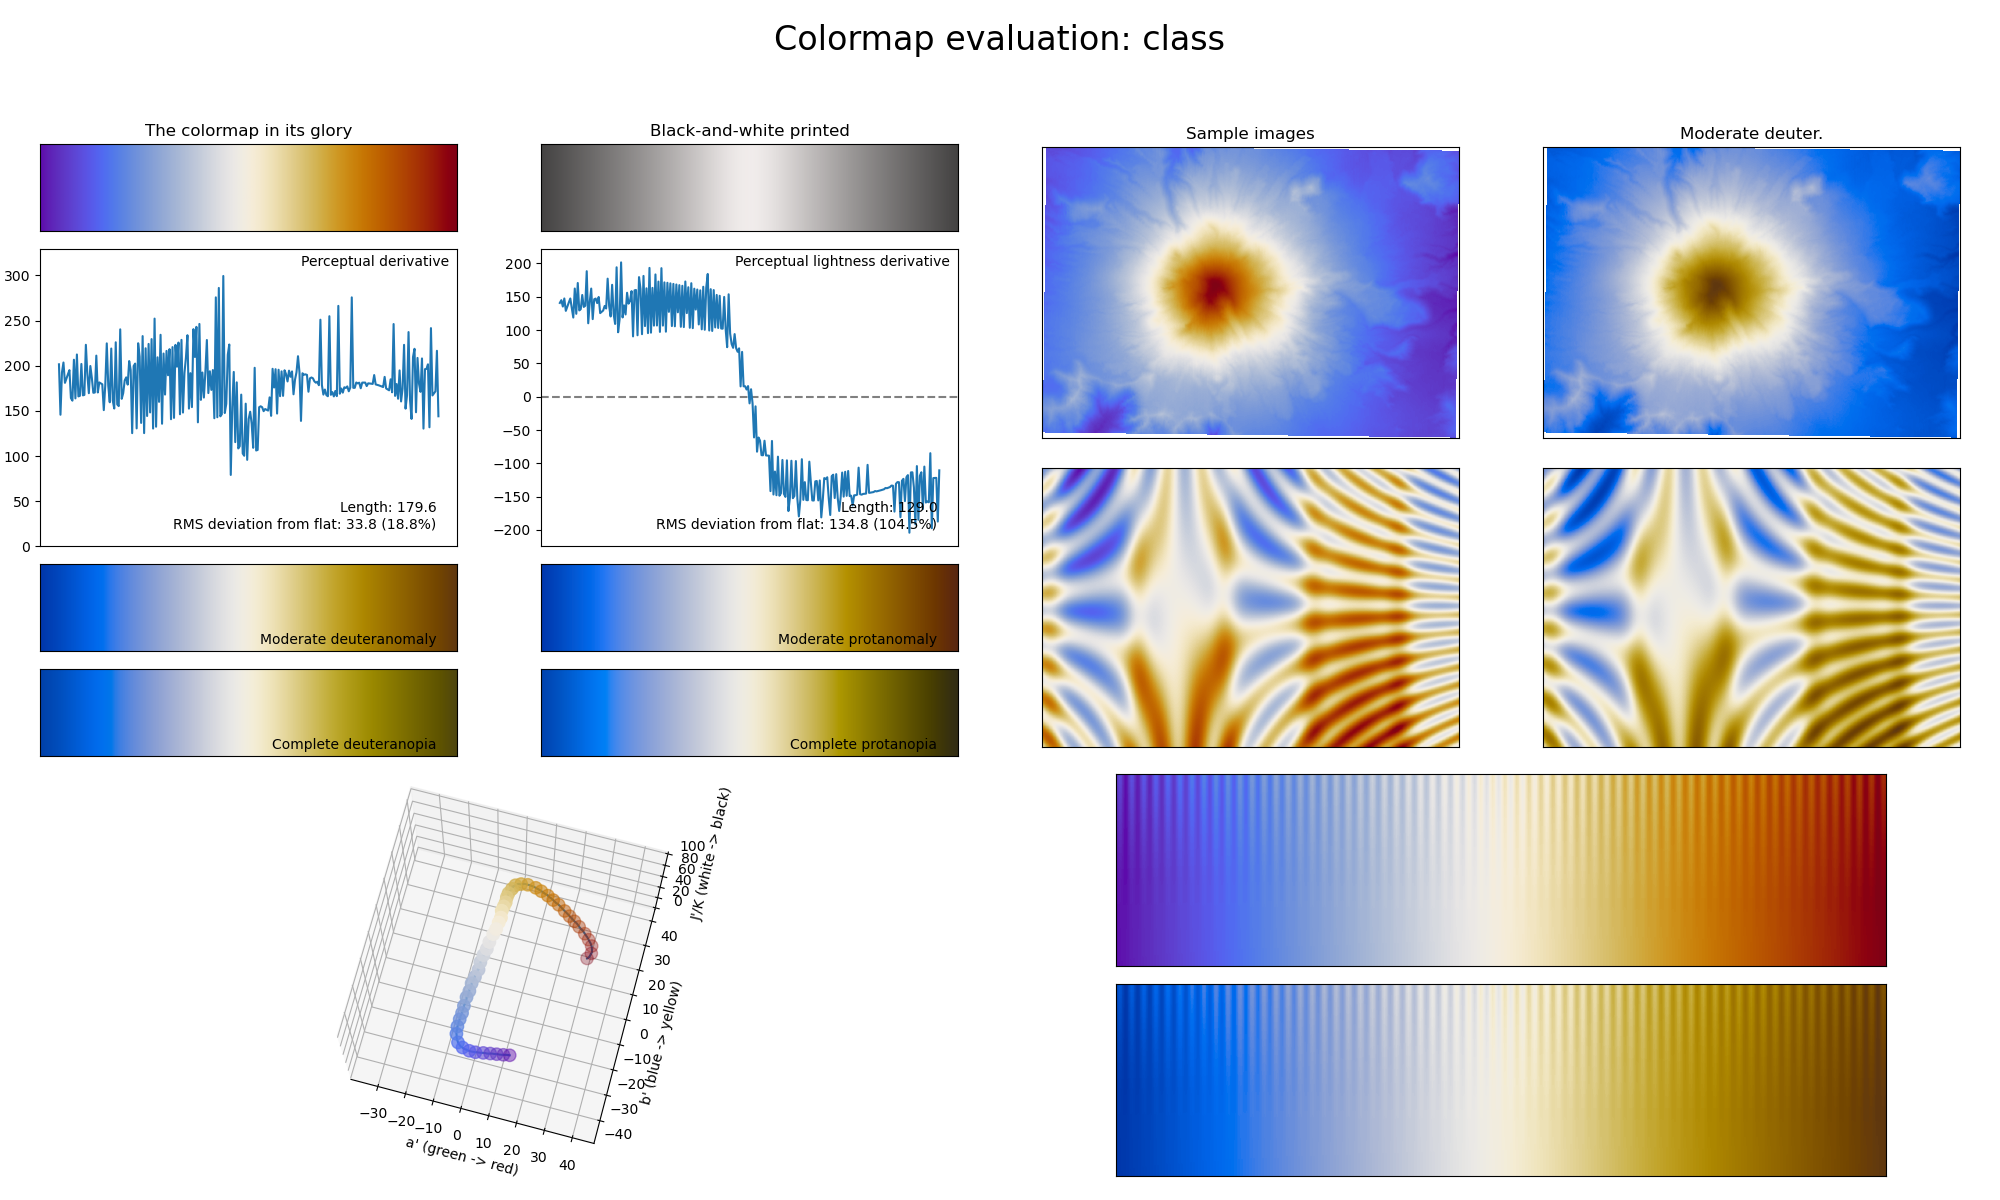
For my second attempt, I started by trying to replicate the Planck colormap in Viscm. In the process, I solicited feedback from my colleagues, resulting in tweaks such as moving the mid point from a neutral gray to a slightly warmer color temperature. While this resolved the perceptual uniformity issues, parts of the colormap were less than uniform for individuals with color vision deficiencies. I then iteratively made changes and ran the results through the CVD metric, until the results roughly matched between typical color vision and red and green color-vision deficiencies. Here is the output of Viscm for the new colormap.
And here is how it performs by my previously-developed metric.

While a significant improvement upon the status quo, the new colormap is not perfect, and I think other diverging colormaps such as Peter Kovesi’s CET-D07 colormap (cet_bjy in Python’s Colorcet package), which is both linear and diverging, or some of Fabio Crameri’s colormaps are better choices for most applications. However, the new colormap is probably good enough for CMB maps, where exact values do not need to be read off of the maps by eye, while keeping a similar aesthetic to existing publications.
A Python file that can be imported to use the colormap with Matplotlib or Healpy and the JSCM output from Viscm are available.
Y. Li et al., “CLASS Data Pipeline and Maps for 40 GHz Observations through 2022”, arXiv:2305.01045. ↩